

What Worked in 2019? Everything, Basically
Stocks rallied strongly in Q4, and full-year returns for both stocks and bonds reflected a sharply positive reversal from 2018 (when virtually every asset class experienced negative returns). In 2019, many diversified stock and bond indexes recorded their best gains in several years. Domestic growth stocks led the way, with the S&P 500 index advancing 31.5%--the index’s best return since 2013. Small-cap and international benchmarks also delivered double-digit gains.
At the same time, tame inflation and a more accommodating shift in monetary policy led interest rates across the yield curve to fall, boosting returns for bonds, particularly longer-term and credit-sensitive debt. The bellwether Barclays Aggregate bond index increased by 8.7% in 2019—its best performance since 2002.
In short, every asset class represented in our clients’ portfolios achieved a positive return in 2019; a typical “balanced” portfolio (Figure 1) would have generated a consolidated return in the mid-high teens (note: your portfolio’s allocation and results may differ—please refer to your Quarterly Portfolio Review Report).
Figure 1

What Accounted for the Swift Bounce Back Between 2018 and 2019?
Partly, the happenstance of the calendar. Before a steep market correction in Q4 of 2018, most domestic stock indexes were on track to finish that year in positive territory. Similarly, a strong stock rally in Q1 of 2019 went a long way toward assuring last year’s robust returns.
Ironically, neither 2018 nor 2019 aggregate stock returns closely tracked the operating results of underlying businesses. As demonstrated in Figure 1.1 (below), global stock returns in 2018 were broadly negative despite positive earnings per share (EPS) growth. Conversely, 2019 equity returns were strongly positive despite flat-to-negative growth in EPS. In both cases, market returns were driven by the expansion or contraction of valuation multiples. Put another way, changes in investor sentiment—reflected in the multiple investors were willing to pay for a stream of future earnings—had the biggest impact on stock market returns. As Benjamin Graham famously noted: “In the short run, the market is a voting machine, but in the long run, it is a weighing machine.”
Figure 1.1
The Fed Put and Stealth QE
In terms of investor sentiment, the most significant positive catalyst between 2018 and 2019 was the shift in policy bias from the U.S. Federal Reserve. After raising the benchmark Fed funds rate nine times between 2015-18 (four times in 2018 alone), the Fed paused in December 2018, indicating that no further rate increases were likely in 2019. Markets responded favorably to this news in Q1. However, continued trade tensions and sluggish manufacturing activity ultimately led the Fed to decrease rates three times (a cumulative 75 basis points) between July and October of last year.
Moreover, an unexpected spike in overnight lending rates in the so-called “repo” market in September prompted the Fed to step in with additional injections of liquidity via the open-market purchase of treasury securities. Some were quick to nickname this intervention a “stealth QE,” an allusion to three prior iterations of “quantitative easing (QE)” undertaken between 2008-14. For practical purposes, the Fed’s latest bond purchases (and balance sheet expansion) are functionally equivalent to the monetary stimulus employed during QE1-3 (even if the Fed’s governors are reluctant to use the same terminology). At the Fed’s January meeting, Chairman Jerome Powell said that he expects the Fed to continue offering support to the repo markets through at least April of 2020.
For perspective, before the 2008 financial crisis, the Fed’s balance sheet held between $700-$800 billion in assets. After three rounds of QE, it reached a peak of nearly $4.5 trillion, where it held steady for a few years before declining (Dec 2017 to Sep 2019), to $3.8 trillion. Since that time, repo interventions have once again boosted Fed assets to nearly $4.2 trillion (Figure 1.2). If investors learned one lesson from QE, it’s that when central banks inject hundreds of billions of dollars of new money into financial markets, asset prices tend to rise. In that sense, it’s not surprising that this latest Fed intervention triggered a resurgence of the “risk-on” trade.
Figure 1.2 – Federal Reserve Total Assets (2018-2020)

Importantly, the Fed is not acting in isolation. Central banks in other parts of the world—notably in the Eurozone and Japan—are also engaged in large scale asset purchases designed to stimulate economic growth and prevent deflation. By year-end 2019, an estimated $11 billion of global debt (and more than 20% of global government debt) was bid up to the prices that implied a negative yield to maturity. The benchmark 10-year U.S. Treasury bond finished the year with a paltry 1.92% yield. Yet, in the context of global sovereign yields (Figure 1.3) this was a relatively attractive rate!
Figure 1.3

Source: JP Morgan
Is a Recession Possible in the Near Future?
Higher U.S. interest rates attract investment from other parts of the world, boosting the value of the U.S. dollar vs. other sovereign currencies. While a strong dollar is a modest boon to U.S. consumers (since it reduces the cost of imports) it is a headwind to export-oriented U.S. industries such as farming and manufacturing—sectors which were already negatively impacted by the ongoing trade war with China, and the selective imposition of punitive trade tariffs. Indeed, the most recent report from the Institute for Supply Management (ISM) showed a contraction in U.S. manufacturing activity for the 5th consecutive month, bringing the index to its lowest level in nearly 11 years (Figure 1.4).
Figure 1.4

While manufacturing is a weak spot in the economy, it appears some relief from trade tensions could be on the horizon. Earlier this month, the U.S. and China formalized “Phase 1” of a trade agreement that promises to increase Chinese purchases of U.S. goods and relax or postpone certain tariffs levied by the two countries. Additionally, the U.S., Mexico, and Canada successfully negotiated a revision to the 25-year-old NAFTA trade agreement (called the USMCA), which has already been approved by Congress and will likely be signed into law by President Trump within days.
Looking beyond manufacturing, other data points paint a generally positive picture of the economy. Last year’s drop in long-term interest rates brought the average 30-year mortgage rate to within 25 basis points of its all-time low, breathing new life into the housing market. December housing starts jumped 17% from the prior year, reaching a 13-year high. The national unemployment rate is hovering around 3.5%, a 50-year low. Consumer spending accelerated in November at the fastest pace in 4 months. Combine these factors with an accommodating central bank, and there is reason to believe that the longest U.S. expansion on record (126 months and counting) could have more room to run.
Large Cap Value (LCV) Review
(Not all clients of Bristlecone are invested in our Large Cap Value Equity portfolio strategy, depending on the size of the overall portfolio, and the client's objectives and constraints)
After fees, the LCV portfolio produced a gain in the low to mid 20s for the full year. Its 2019 performance lagged the S&P 500 but was broadly in line with the large value peer group (as measured by the Morningstar Large Value index). In what is becoming a familiar, disappointing refrain (we’ve written about it in several times in the past few years), the S&P 500 has of late been a tough benchmark for large-cap active managers (particularly value managers) because it is increasingly dominated by the performance of a relative handful of very large tech companies.
In August of 2018, Apple (AAPL) became the first U.S. public company to reach $1 trillion in market capitalization. Within the next 18 months, three more U.S. companies achieved that milestone valuation: Microsoft (MSFT), Amazon (AMZN), and Alphabet (aka Google – GOOG). As these companies increased in value, so did their weight within the S&P 500 index. For perspective, a $1 trillion market cap is roughly 42x the size of the median market cap among the 500 companies in the index. Currently, the ten largest companies account for almost 25% of the index. The top 5 companies constitute more than 17% of the index. The two largest companies (AAPL and MSFT) together generated nearly 15% of the index’s total return in 2019.
Officially, the Information Technology sector constituted 23.2% of the S&P 500 index at year-end (Figure 1.5). Outside of a very brief window at the tail end of the 1990s tech bubble, this is about as high as it has ever been. However, even that figure likely understates tech’s influence. That’s because 3 of the top 5 weights in the index—companies usually associated with the tech industry—are now categorized within other sectors by S&P Dow Jones. Both #3 Alphabet (GOOG) and #5 Facebook (FB) are part of the “Communication Services” sector. #4 Amazon (AMZN) belongs to the “Consumer Discretionary” sector. If just those three companies were instead consolidated within Information Technology, it would bring the sector’s weight to nearly 32%.
Figure 1.5 – S&P 500 Sector Breakdown (12/31/19)

Source: S&P Dow Jones
As it happens, Information Technology was the best performing S&P sector in 2019, rising 50%. The next best performing sector was Communications Services (+33%). These also happen to be the two sectors trading at the largest multiples of expected earnings (21.8x and 22.2x, respectively), which means they are typically underrepresented in value-oriented portfolios (Bristlecone’s LCV portfolio has approximately 5% in Information Technology and 2.5% in Communications Services). All of this helps to explain why value indexes have had such a long period of underperformance (Figure 1.6), rivaling the lag of the late 90s.
Figure 1.6 – Value-Growth Differential 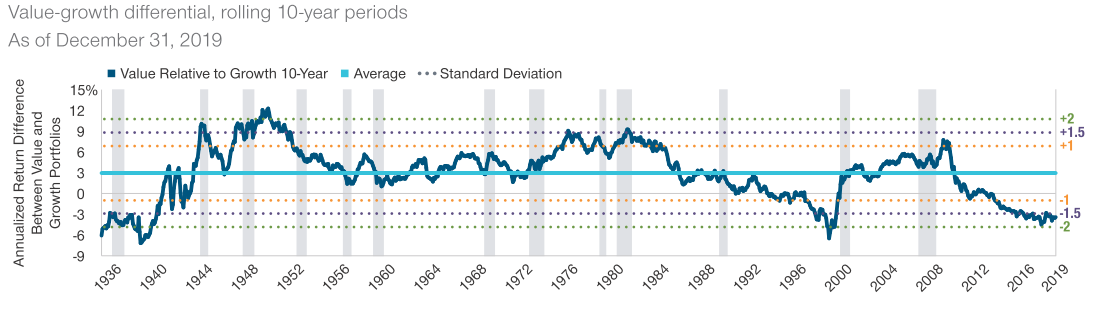
Source: T Rowe Price Insights – Jan 2020 “Value Stock Investing Disrupted but Not Destroyed”
"Taking The Road Less Traveled"[1]
Another critical factor has been the rise in passive-investing strategies. For most of the last decade, actively managed stock funds have had net withdrawals, while passive (index-based) funds and ETFs have been gaining assets. In mid-2019, passive strategies finally eclipsed active funds in assets under management (Figure 1.7). Passive funds are designed to track the performance of a stock index (usually a market-cap weighted index such as the S&P 500). When an investor makes a purchase, it is simply allocated among all the stocks in the index, in proportion to their respective weights—without any analysis at the individual stock level.
Figure 1.7

The flood of new investment into index-based products creates a self-reinforcing effect, whereby existing stocks in an index benefit from algorithmic buying pressure only by virtue of their membership in that group. All else being equal, this buying pressure lifts valuations for index constituents relative to non-constituents.
Indeed, in our bottom-up search for fundamental value among large-capitalization stocks, Bristlecone has increasingly been looking outside of the S&P 500 index. As of December 31st, close to half of the positions in the LCV portfolio (by weight) are stocks which, for one reason or another, are not part of the S&P 500 index. Our portfolio includes 31 stocks, ten of which account for nearly half of the total, and looks nothing like an index. To further illustrate, the only purchase we made during Q4 was to increase our position in long-term holding Qurate Retail (QRTEA)—the parent of QVC—a company whose market cap is larger than some others in the S&P 500, but whose complex ownership structure and limited free float of shares excludes it from membership in the index.
Central bank interventions since the last financial crisis have undermined interest rates as an effective pricing mechanism. Today, lower-quality corporate credits find it relatively easy to borrow on attractive terms. Low rates also reduce the opportunity cost of investing in money-losing businesses with high “growth” trajectories (as much of the venture capital industry is doing right now). Finally, lower discount rates increase the present value of a company’s future cash flows. All of this makes it easier for some investors to rationalize paying 22x forward earnings (equivalent to an “earnings yield” of about 4.5%).
In mid-2007, near the peak of the last economic cycle, former Citigroup CEO Charles Prince defended his firm’s decision to continue financing increasingly risky private equity deals, rationalizing “As long as the music is playing, you’ve got to get up and dance.” This is the investment banking version of a psychology that Millennials will quickly identify as FOMO (Fear of Missing Out).
However, one of the core tenets of value investing—what Benjamin Graham referred to as a “margin of safety”—is that buying stocks cheaply (relative to their stream of discounted future earnings) is one of the best ways to reduce your risk of a permanent loss of capital. The metaphorical corollary (attributed to Warren Buffett) is that nobody is forcing you to swing at bad pitches. We don’t need to pay a high price for a cheery consensus, nor do we need to keep dancing just because the music is playing. At the end of the day, we’re much more focused on protecting our clients from a permanent loss of capital, even if it means watching some pitches go by.
As always, we welcome your comments and feedback, and continue to appreciate your trust in our services.
[1] With apologies to Robert Frost
One of Bristlecone Value Partners’ principles is to communicate frequently, openly and honestly. We believe that our clients benefit from understanding our investment philosophy and process. Our views and opinions regarding investment prospects are "forward looking statements," which may or may not be accurate over the long term. While we believe we have a reasonable basis for our appraisals, and we have confidence in our opinions, actual results may differ materially from those we anticipate. Information provided in this blog should not be considered as a recommendation to purchase or sell any particular security. You can identify forward looking statements by words like "believe," "expect," "anticipate," or similar expressions when discussing particular portfolio holdings. We cannot assure future results and achievements. You should not place undue reliance on forward looking statements, which speak only as of the date of the blog entry. We disclaim any obligation to update or alter any forward-looking statements, whether as a result of new information, future events, or otherwise. Our comments are intended to reflect trading activity in a mature, unrestricted portfolio and might not be representative of actual activity in all portfolios. Portfolio holdings are subject to change without notice. Current and future performance may be lower or higher than the performance quoted in this blog.
References to indexes and benchmarks are hypothetical illustrations of aggregate returns and do not reflect the performance of any actual investment. Investors cannot invest in an index and returns do not reflect the deduction of advisory fees or other trading expenses. There can be no assurance that current investments will be profitable. Actual realized returns will depend on, among other factors, the value of assets and market conditions at the time of disposition, any related transaction costs, and the timing of the purchase.
Economic factors, market conditions, and investment strategies will affect the performance of any portfolio and there can be no assurance that a portfolio will match or outperform any particular index or benchmark. Past Performance is not indicative of future results. All investment strategies have the potential for profit or loss; changes in investment strategies, contributions or withdrawals may materially alter the performance and results of a portfolio. Different types of investments involve varying degrees of risk, and there can be no assurance that any specific investment will be suitable or profitable for a client's investment portfolio.
This content is developed from sources believed to be providing accurate information, and it may not be used for the purpose of avoiding any federal tax penalties. Please consult legal or tax professionals for specific information regarding your individual situation. The opinions expressed and material provided are for general information, and should not be considered a solicitation for the purchase or sale of any security.